import matplotlib.pyplot as plt Add a watermark
Sometimes you want a big fat text on your chart that says that these are preliminary results.
f, ax = plt.subplots()

import matplotlib.patheffects as path_effects

watermark_text = 'draft'
t = ax.text(0.5, 0.5, watermark_text, transform=ax.transAxes,
        fontsize=80, color='white', alpha=0.3,  weight="bold",
        ha='center', va='center', rotation='30')
t.set_path_effects([path_effects.Stroke(linewidth=3, foreground='lightgray')])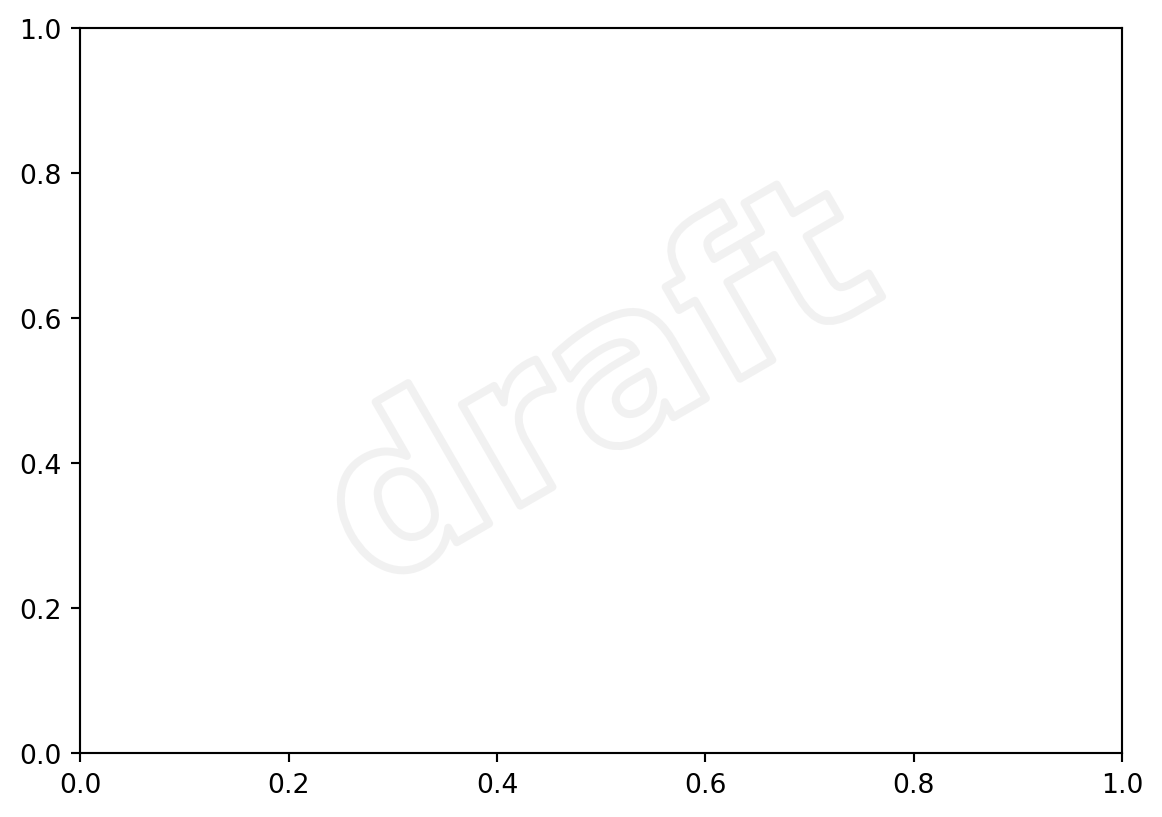
Change color='white' to make it colorful. The edge color is encoded in set_path_effects as foreground.
Add a footnote
Bottom right
f, ax = plt.subplots()

footnote = [
    'Data source: XY',
    'Author: TK'
]

ax.annotate('\n'.join(footnote),
            xy = (1.05,0), xycoords=ax, ha='left', va='bottom',
            fontsize=8, style='italic',
            bbox=dict(boxstyle='square,pad=0.0',fc='none', ec='none')
        )
Text(1.05, 0, 'Data source: XY\nAuthor: TK')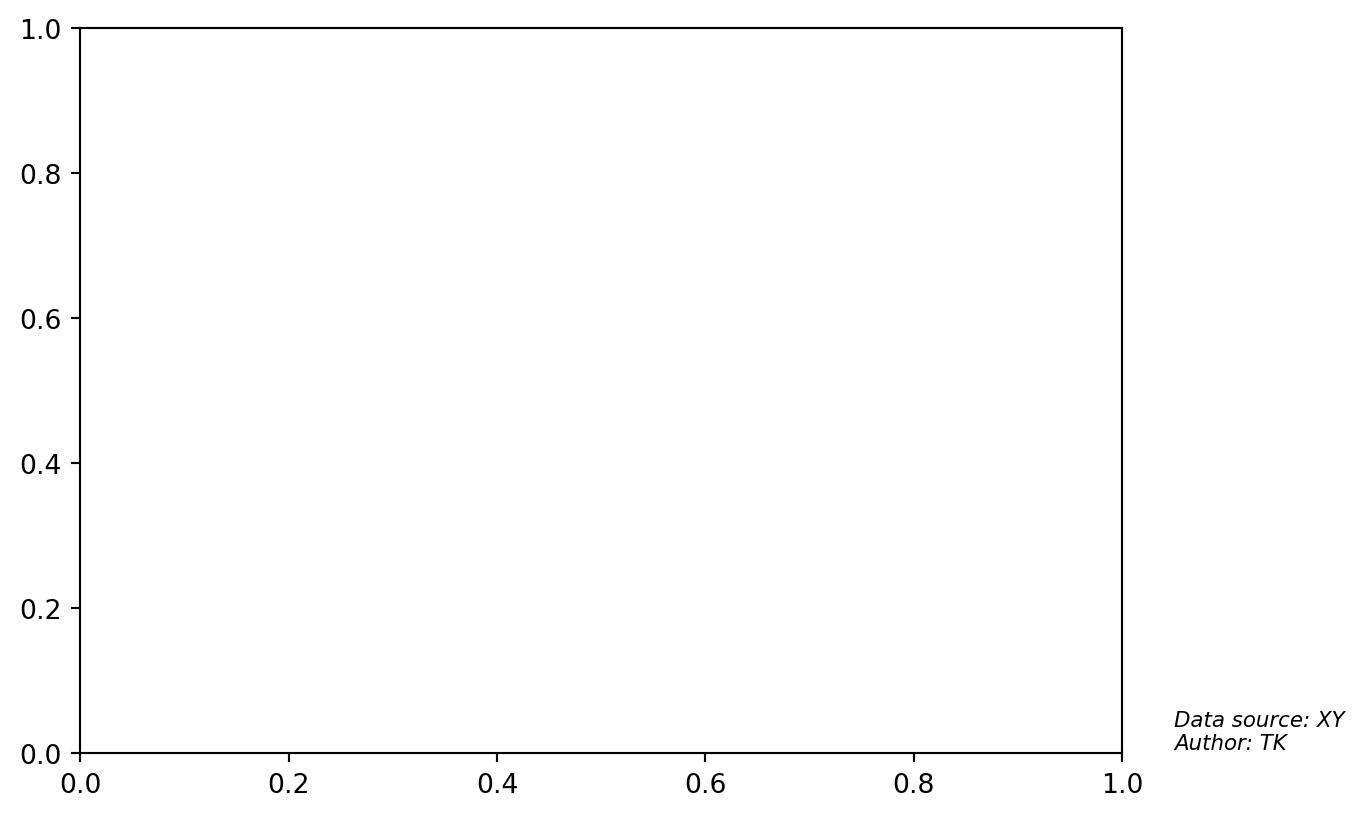
The footnote is positioned relative to the axes (xycoords+ha+va). The pad is removed. Aligning to bottom makes it robust for multiline entries.
Bottom left under the chart
f, ax = plt.subplots()

footnote = [
    'Data source: XY',
    'Author: TK'
]

ax.annotate('|'.join(footnote),
            xy = (0,-0.25), xycoords=ax, ha='left', va='top',
            fontsize=8, style='italic',
            bbox=dict(boxstyle='square,pad=0.0',fc='none', ec='none')
        )
Text(0, -0.25, 'Data source: XY|Author: TK')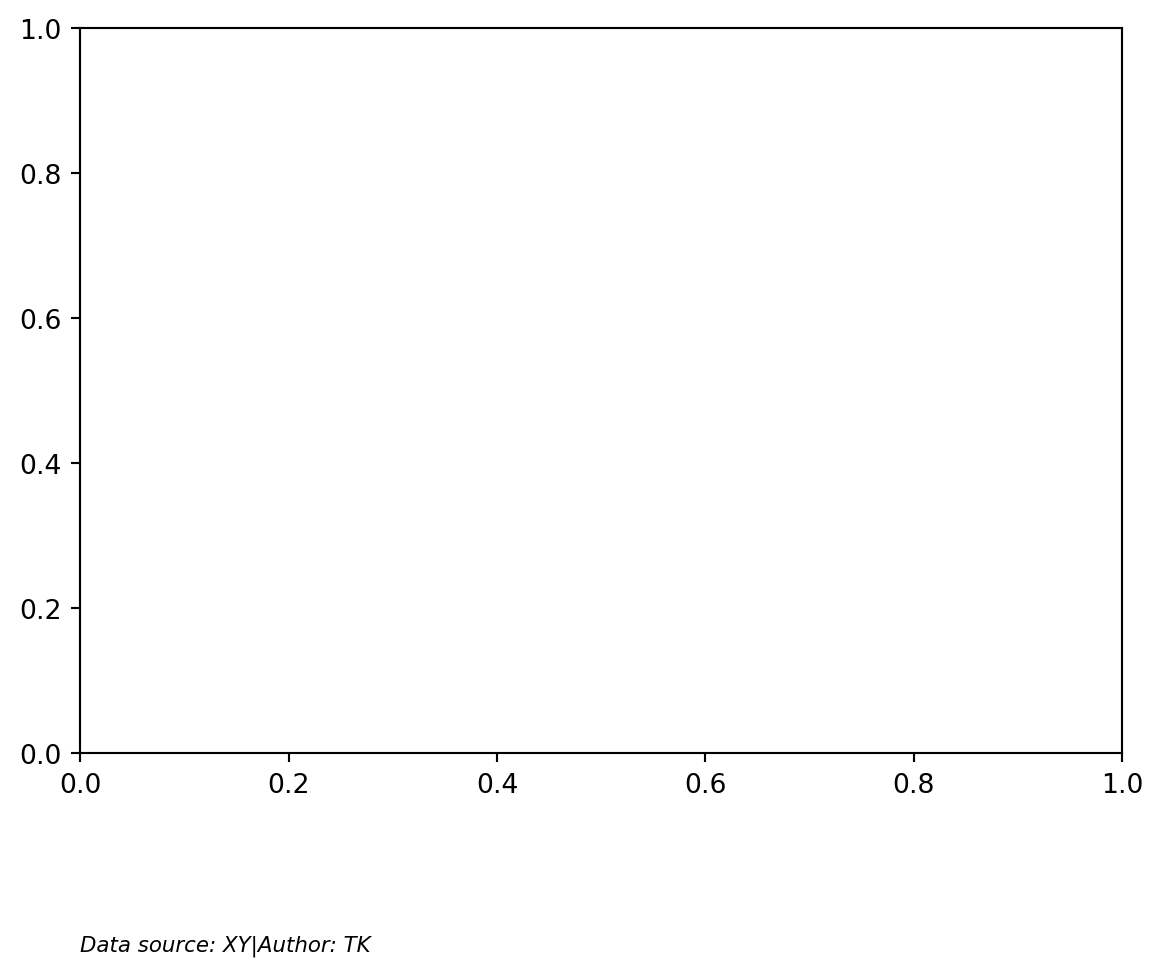
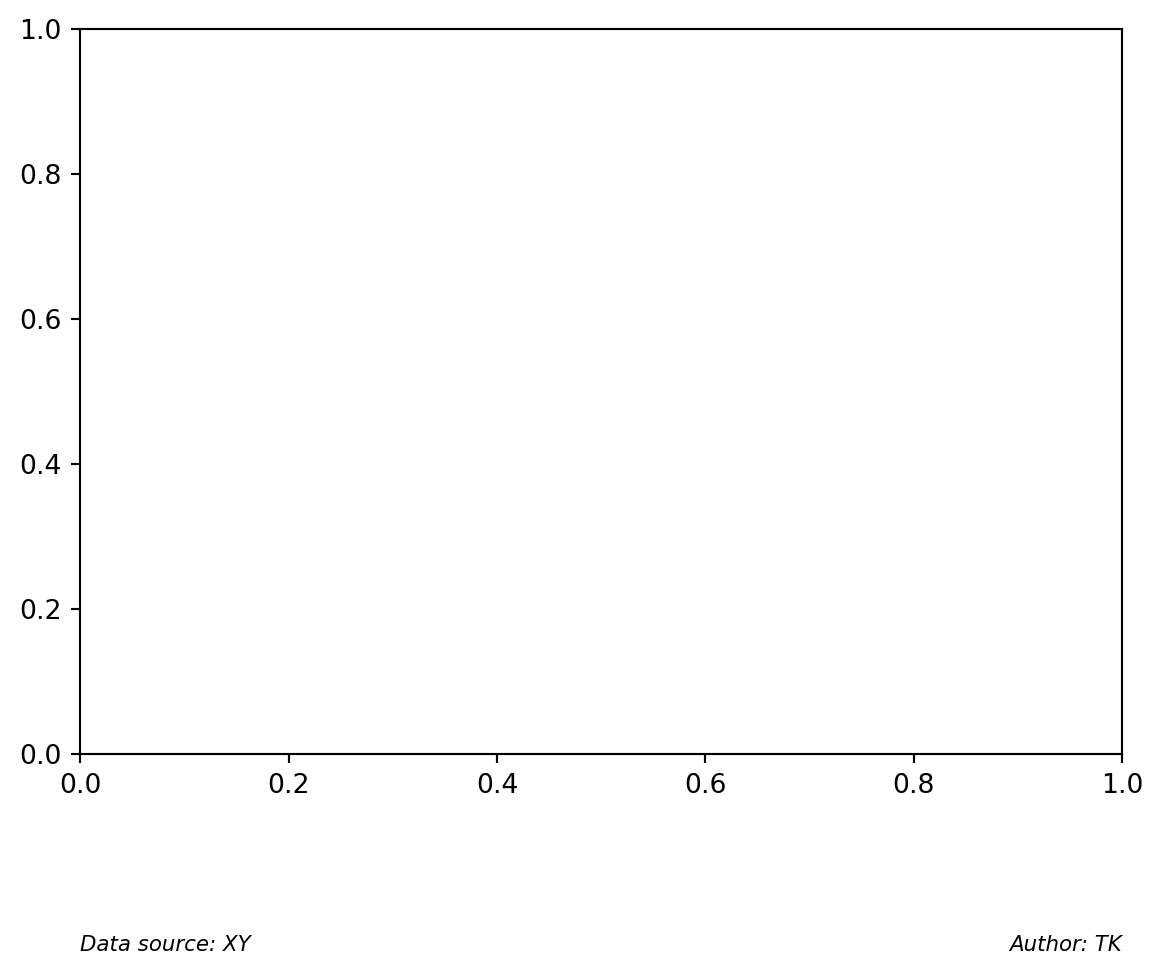
f, ax = plt.subplots()

footnote = [
    'Data source: XY',
    'Author: TK'
]

ax.annotate(footnote[0],
            xy = (0,-0.25), xycoords=ax, ha='left', va='top',
            fontsize=8, style='italic',
            bbox=dict(boxstyle='square,pad=0.0',fc='none', ec='none')
        )
ax.annotate(footnote[1],
            xy = (1,-0.25), xycoords=ax, ha='right', va='top',
            fontsize=8, style='italic',
            bbox=dict(boxstyle='square,pad=0.0',fc='none', ec='none')
        )
Text(1, -0.25, 'Author: TK')