import matplotlib.pyplot as plt
import numpy as np
%matplotlib inlineSometimes we may want to create an image with plotting API of matplotlib, but then apply a transform that only works for numpy arrays (for example, skimage’s warps). This is how you do it:
Let’s generate an example chart:
x = [1,2,3]
bars = [10,15,12]

f, ax = plt.subplots(dpi=100)
# when using plt.subplots, the canvas and renderer get created automatically
ax.bar(x, bars);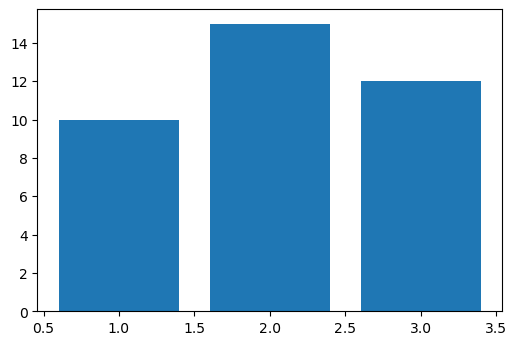
Export the figure to a numpy array
Method 1 src
s, (width, height) = f.canvas.print_to_buffer()
rgba = np.frombuffer(s, np.uint8).reshape((height, width, 4))
plt.imshow(rgba, aspect='equal');
print(type(rgba))
print(rgba.shape)
<class 'numpy.ndarray'>
(400, 600, 4)Method 2 src
rgba = np.asarray(f.canvas.buffer_rgba())
plt.imshow(rgba);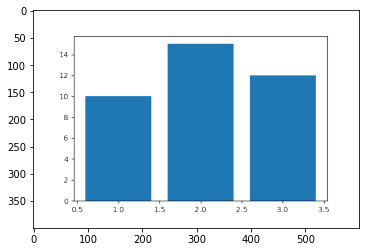
print(type(rgba))
print(rgba.shape)
<class 'numpy.ndarray'>
(400, 600, 4)Remove the alpha channel in a numpy array (RGBA->RGB)
To remove the alpha channel it’s enough to run: src
rgb = rgba[:,:,:3]The resulting chart is the same (our transparency is anyway white)
plt.imshow(rgb);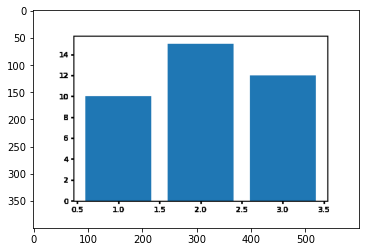
Both methods respect the dpi set when creating the figure using plt.subplots
Warping images using skimage
Now we can warp the image:
from skimage.transform import swirl

swirled = swirl(rgb, rotation=0, strength=30, radius=120)
f, ax = plt.subplots(ncols = 2, figsize=(10,4))
ax[0].imshow(rgb, aspect='equal')
ax[0].set_title('original')
ax[1].imshow(swirled, aspect='equal')
ax[1].set_title('warped')
[a.axis('off') for a in ax];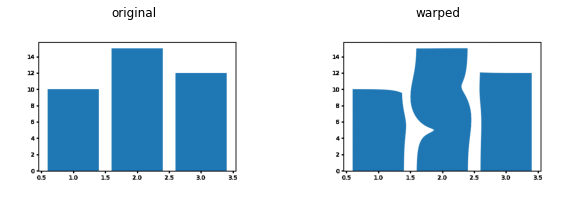
More on skimage transforms: https://scikit-image.org/docs/stable/api/skimage.transform.html